observability
Last updated: 2025-11-05 01:14:51.081434 File source: link on GitLab
Observability Package
Table of Contents
Overview
The Observability package provides a comprehensive solution for monitoring and troubleshooting DMS. It includes:
Configurable, structured logging with outputs to the console, files, and optionally Elasticsearch.
Custom event emission using a LibP2P event bus.
Distributed tracing with Elastic APM integration.
Label-based routing for log messages to control log destinations.
Dynamic runtime configuration and a no-op mode for testing.
Features
Logging
Console logging with colorized output for ease of development.
File-based logging using a rolling file writer (via lumberjack).
Optional Elasticsearch logging for centralized log management.
Dynamic log level configuration (DEBUG, INFO, WARN, ERROR, etc.).
Custom Event Emission
Leverages LibP2P's
EventBusto emit application events.Events adhere to the
CustomEventschema for downstream processing.
Distributed Tracing
Integrated with Elastic APM for distributed tracing.
Automatic system metrics collection (CPU, memory, disk, network).
Custom instrumentation via the
StartTracehelper.
Label-Based Routing
Attach labels to log messages to determine routing decisions.
Override default Elasticsearch index or skip ES logging based on labels.
Predefined labels include:
default,accounting,metric,deployment,allocation,node, anduser.
Internal Architecture and Event Bus Explanation:
We Do Actually Have an “Internal Event Bus.”
The “internal event bus” is created via Libp2p’s host.EventBus() inside observability.initEventBus(...). We attach a custom emitter to that bus (customEventEmitter), and the code in newEventEmitterCore(...) in observability.go will emit every log entry as a CustomEvent to that bus.
Why You Don’t See the Word “Collector.”
In an older design we talked about “collectors” as separate pipelines for sending logs to console, file, Elasticsearch, etc. In the current code, that same concept is implemented using multiple Zap cores in a “tee.” Each core (console, file, Elasticsearch, event bus) is effectively a “collector,” but we just don’t label them that way in the code anymore. You can see this in observability.initLogger(...), which calls createConsoleCore(...), createFileCore(...), createElasticsearchCore(...), and newEventEmitterCore(...). Then, all those cores are combined via zapcore.NewTee(cores...).
Where Is the “Internal Event Bus” Actually Implemented?
It is initialized in initEventBus in observability.go. We then wrap it with a custom Zap Core in the newEventEmitterCore function, which creates the eventEmitterCore. Inside that core’s Write(...) method, the log data is packaged into a CustomEvent struct and emitted via customEventEmitter.Emit(customEvent). This is exactly what ships logs onto the Libp2p event bus.
Summary:
Zap + Multiple Cores = The old notion of multiple “collectors” (console, file, Elasticsearch).
Event Emitter Core = The “internal event bus” hook, which you can subscribe to for advanced use cases (like a future reputation system).
Default Label = The fallback if a caller doesn’t specify any label at all.
Everything happens in the observability package, but we rely on the Libp2p host’s event bus. No extra “collector” objects are defined by name—the pattern is just a combination of Zap “tee’d cores” plus the event bus emitter.
Runtime Configuration
Dynamically enable/disable Elasticsearch logging.
Update Elasticsearch endpoint, APM server URL, API key, and flush interval at runtime.
No-op mode to disable all observability features during testing.
Dependencies
LibP2P (go-libp2p) Provides the
host.Hostfor event bus integration.Zap (go.uber.org/zap) The primary structured logging library.
Lumberjack (natefinch/lumberjack) Manages rolling log files for file-based logging.
Elasticsearch Client (olivere/elastic) Used to index logs into Elasticsearch.
Elastic APM (go.elastic.co/apm) Enables distributed tracing and custom metric collection.
Initialization
Before using any observability features, we initialize the package. This is done in the network package where the LibP2P host is set up.
initialization snippet from network\libp2p\libp2p.go:
This setup:
Configures logging (console, file, and optionally Elasticsearch).
Sets up the event emitter on the LibP2P
EventBus.Initializes Elastic APM tracing if
cfg.APM.ServerURLis provided.
Usage
Logging
The package uses Zap for structured logging. After initialization, you can produce logs as follows:
Dynamic Log Level Adjustment
Log levels can be updated at runtime:
Tracing
Elastic APM is integrated for distributed tracing. Use the helper function StartTrace to begin new transactions or spans.
Usage examples:
If a transaction is already present (e.g., via APM-enabled Gin middleware), StartTrace creates a child span; otherwise, it starts a new transaction.
Label-Based Routing
Logs can be annotated with labels to control routing:
The label injection core processes the labels field:
Logs tagged with specific labels may be routed to an override Elasticsearch index (e.g., "accounting-index").
Alternatively, logs can be skipped for Elasticsearch if configured.
Adding a New Zap Core
This observability package sets up multiple zap cores (console, file, Elasticsearch, etc.) and combines them into a single logger in the initLogger function. To add a new core you can follow the same pattern:
Create Your
createXCoreFunction In your new function, mirror the style of our existing core-creation functions (e.g.,createConsoleCore,createFileCore,createElasticsearchCore). Typically, you will:Configure an encoder (
zapcore.EncoderConfig).Set up a writer (e.g., to a file, stdout, a network sink, or anything else).
Return a new core using
zapcore.NewCore(...), along with theatomicLevelfor controlling log levels.
Add the New Core in
initLoggerInsideinitLogger(where we build the logger), follow the approach used for the other cores:Call your new
createXCore(...)function.Handle any errors (e.g., if creation fails, log a warning or decide how you want to proceed).
Append the newly created core to the
coresslice, which is eventually passed tozapcore.NewTee(cores...).
Leverage Shared Fields and Wrappers Just like our other cores, you can attach shared fields (e.g., the DID field) by calling
.With([]zapcore.Field{ ... })on the core. Also note that the package wraps the combined Tee core withnewLabelInjectionCore(for label-based routing) and includes an event emitter core. Your new core will automatically benefit from these features so long as you add it ininitLoggerjust like the others.Verify No-Op Mode and ES Disabled States (If Relevant) If your new core relies on external resources, consider how
noOpModeor similar package-level flags (likeesDisabled) might affect it. For instance, you may want to skip initialization if the environment or config dictates that your service shouldn’t produce logs to that destination at certain times.Document Configuration If your new core requires additional config fields (such as a new URL or API key), add them to
config.Observabilityor wherever your configuration is stored, and update your function accordingly so that everything is initialized properly.
By following these steps and modeling your function after our existing create*Core methods, you can seamlessly add a new core to the combined logger in a way that remains consistent with the rest of the observability package.
Runtime Configuration
Observability supports dynamic reconfiguration at runtime:
Enable/Disable Elasticsearch Logging:
Set Elasticsearch Endpoint:
Set APM Server URL:
Update API Key (for Elasticsearch and APM):
Set Flush Interval for Elasticsearch Logs:
Toggle No-Op Mode:
Testing
For unit tests, disable observability side-effects by enabling no-op mode:
This ensures that logging, Elasticsearch, and APM tracing are effectively disabled during tests.
Shutdown
To properly release resources and flush logs/traces, call:
This function:
Flushes and closes Elasticsearch log buffers.
Closes the custom event emitter.
Shuts down the Elastic APM tracer if enabled.
Example usage in the main function:
but it also happens automatically
Enabling Observability
The top-level trace is called based on the DID, eg DMS-did:key:z6Mku1nVmZ9AQywxSUpWuAH2uen8SswqFHKkrRWAjs4gD9Uk, but can be overridden via ELASTIC_APM_SERVICE_NODE_NAME.
Local ELK Stack
Source: Getting started with the Elastic Stack and Docker Compose: Part 2 Login: elastic / changeme
git clone https://github.com/elkninja/elastic-stack-docker-part-two.gitcd elastic-stack-docker-part-twodocker-compose upGenerate a certificate
docker cp es-cluster-es01-1:/usr/share/elasticsearch/config/certs/ca/ca.crt /tmp/.openssl x509 -fingerprint -sha256 -noout -in /tmp/ca.crt | awk -F"=" {' print $2 '} | sed s/://gcat /tmp/ca.crt
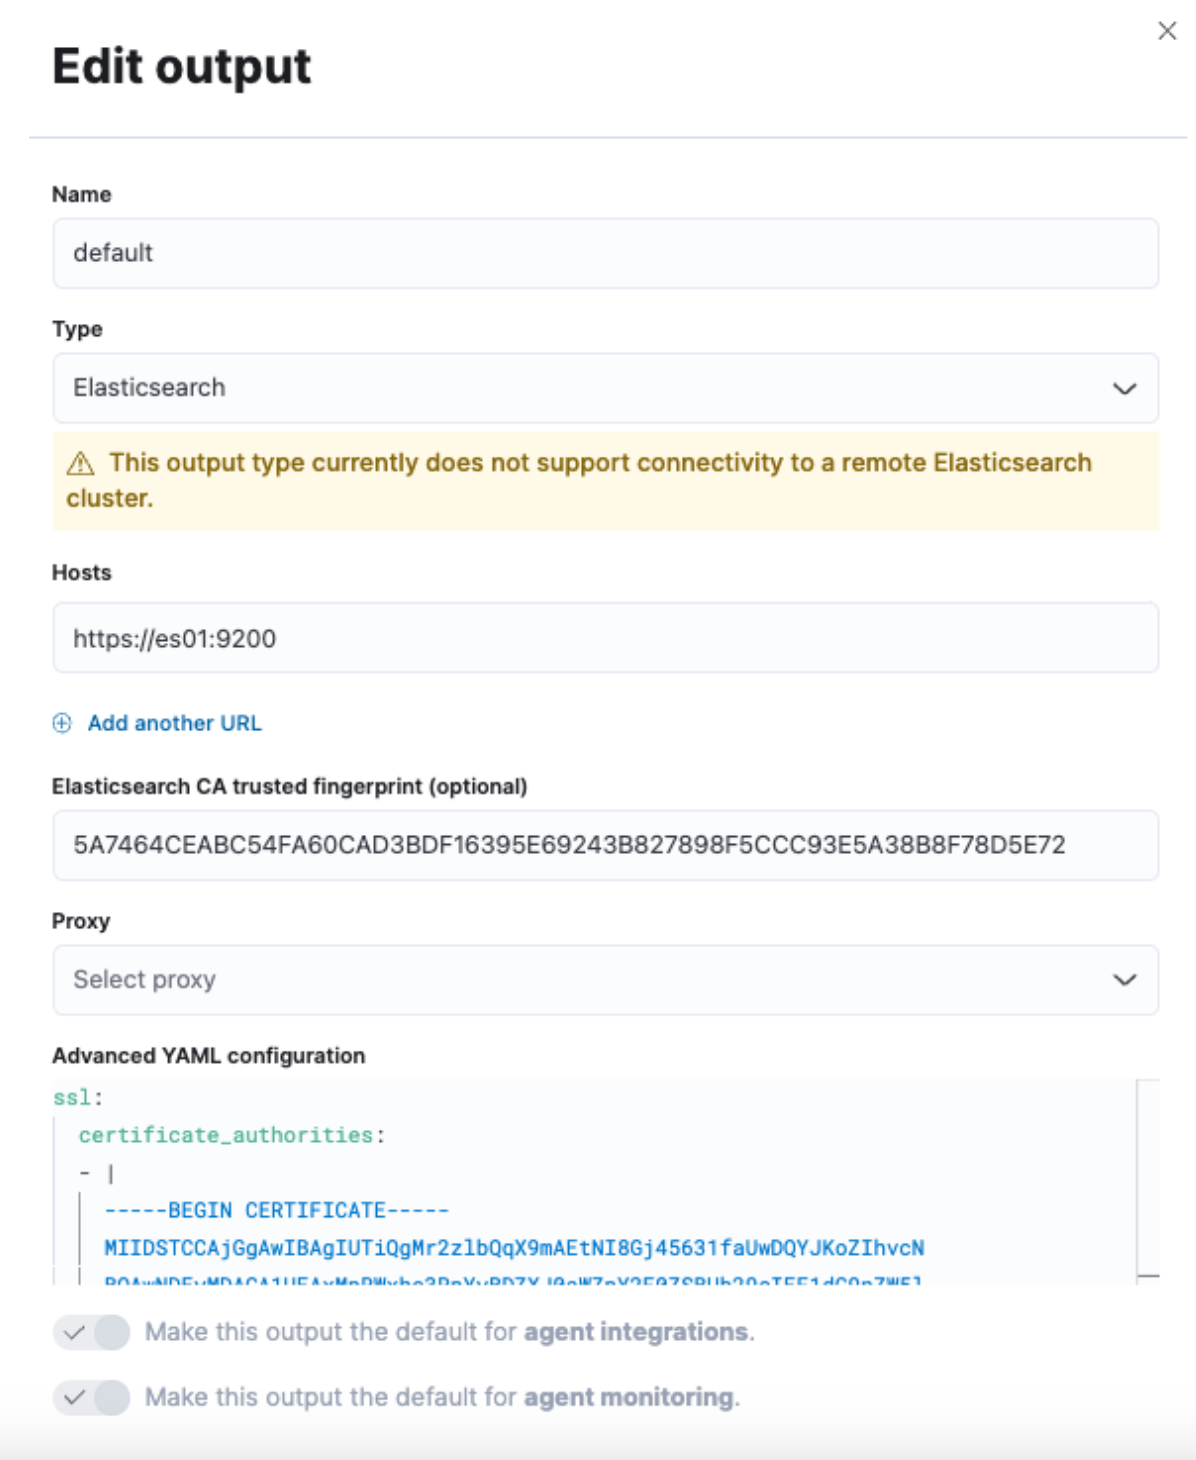
Visit https://localhost:5601/app/fleet/settings/outputs/fleet-default-output
make the form look like this image
update "Hosts" to
https://es01:9200update "... fingerprint" to the output from step 4.2
update and indent "Advanced YAML config"
then "Save and Deploy"
Create a data view called "dms-logs"
"Index pattern":
nunet-dms,*-index
Create an API key
https://localhost:5601/app/management/security/api_keys/create
Update config:
apm.server_url = "http://localhost:8200"apm.secret_token = "supersecrettoken"observability.elasticsearch_url = "https://localhost:9200"observability.elasticsearch_api_key = "STEP6"
Results available after stopping the DMS and waiting for a bit:
Last updated